Natural Resources (Renewable and Non-Renewable)
According to a USGS fact sheet provided by the Minerals Education Coalition, 2021, (1) each person in the United States requires over 40,630 pounds of minerals each year—both energy and non-energy materials distributed across all sectors of American society. This includes non-renewable energy materials and non-energy materials.
Click on images for a larger view.
Resources vs. Reserves
Non-renewable resources, both energy and non-energy (minerals) related, are evaluated as both a resource or a reserve.
A resource an estimate of the amount of a geologic commodity that exists in both "discovered" and "undiscovered" deposits. The volume or value of a resource is a "best guess" at what might be available.
Reserves are a portion of a resource that have been discovered, that has a known size or volume that can be extracted at a profit.
Note that as the price fluctuates for a geologic commodity (resource), the volume of the reserves will increase or decrease. Factors that affect profitability include the demand for a resource, it's market price, the cost to mining or produce the resource, the cost to transport the resource to where it is consumed; and, of course, politics. The value of a resource can change significantly over time, and adds to the risk of investing in resource extraction. New technologies that can extract the material at a lower price or a discovery of a new source can drive down the value of a resource. Corporate competition, taxes, environmental laws, and government price controls, political instability, and especially wars, can influence a deposit's economic value.
It should also be noted is this amount of material extracted from the ground also involves the land consumed to prospect, produce, and process, and transport these material to the location of their distribution and consumption. Oil & gas fields, coal mines, nuclear power plants, reservoirs, precious metals and mineral mines, and their processing and storage facilities, take up a large amount of land.
As the global human population grows and prospers, the demand for energy and mineral resources is ever increasing (despite efforts to curb the use of fossil fuels: oil, gas, and coal). Nations around the world (guided by the United Nations Climate Action (2) ) are working to find alternative and sustainable energy resources, but this may take years or decades to accomplish.
Example − The Copper Industry: Booms and Busts
Wars and international crises have influenced the price of copper (Figure 2). The US Civil War, WWI and the Korean War created spikes in demand for copper (whereas during WW2 the US government controlled the market price and distribution). The copper industry has experience numerous "boom to bust" ventures over time. Examples include:
Pierre-Eugène Secrétan, a French copper industrialist and artist, made a fortune the copper market in the 1870s. He donated 60,000 kilograms of copper to make the Statue of Liberty. He lost his fortune in 1889 with a failed attempt to control the copper market.
The Amalgamated Copper Company between 1899 to 1915 was a holding company that managed the American copper industry (starting with a massive copper mining operation near Butte, Montana). The price of copper fluctuated with changing supplies and demand as other large copper mining operations came online. Amalgamated later became the Anaconda Copper Mining Company in 1915.
Post WW2, the price of copper tends to follow the price of crude oil in the commodities market. Today’s copper market is also largely influenced by the demand for copper for electric automobile and alternative energy markets.
Critical Minerals
Raw Materials Produced In the United States
Raw materials include agriculture and forestry products, non-fuel minerals (including construction materials, industrial minerals, metals [including recycled metals] and non-renewable organics (oil & gas, coal, and their derivatives).
The availability of raw materials is closely monitored by many Federal and State government agencies and associations affiliated with corporate interests. Figure 4 is a chart listing U.S. raw materials by various categories. (3)
Energy Consumption
In 2019, U.S. Energy Information Administration projected that the world energy consumption will grow by nearly 50% by the year 2050, led by the greatest growth in demand in Asia. (4) The demands for production and consumption are partly determined by the ebb and flow of the global economy. For instance, the CoVid19 pandemic and political posturing has had a significant influence on global supply and demand of natural resources.
- 956 gallons of petroleum
- 3,593 pounds of coal
- 101,338 cubic feet of natural gas
- 0.12 pounds of uranium
Figure 6 shows the projected rate of global energy consumption projected into the future to 2050. (5)
Figure 7 shows past to current global energy consumption by source (1800 to 2020). (5)
Figure 8 shows energy consumption in the United State by source (1776 to 2020). (6)
Non-Renewable Fossil Fuel Energy Resources
Oil & Gas
In 2020, the United States dominated the world in crude oil production and consumption. (7)
The greatest amount of US production comes from Gulf Coast region (offshore) and from Texas (onshore).
Oil and gas has been produced from sedimentary basin regions throughout portions of the United States since oil production began in the late 19th century.
Figure 10 shows an aging oil field in the southern Central Valley of California.
Figure 11 shows a drilling operation offshore of Santa Barbara, California.
Figure 12 is shows a map database that shows the location of the major (and minor) oil and gas production regions of the United States.
The USGS Energy Resources Program conducts periodic assessments of the nation's oil and natural gas reserves and resources.
For more information about the different oil and gas production regions, click here to go to the USGS map database illustrated in Figure 10. (9) Zoom in and click on the map to see regional assessment results, geologic reports, input and output data and spatial data are available for download. You can use the search bar to enter location details or click on any province to find information related to that regional oil & gas province.
Coal
China, Indonesia, and India are the largest coal producing countries. Coal was a primary source of energy in the United States until the 1950s when the country began its love affair with increasingly inexpensive gasoline, and oil and gas pipelines where constructed to connect oil fields, ports with refineries nearby, to major cities across the United States. The amount of coal being mined and consumed in the country is diminishing as the country is migrating away from coal power plants to cleaner alternative sources. However, it still remains the 3rd largest source of energy consumed in the country. Figure 13 is a map of the location and types of coal produced in the United States. (11) Figure 14 illustrates one of the largest coal mining operations in Wyoming—the state that produces the most coal in the country.
Alternative and Renewable Energy (non-fossil fuel energy)
Geothermal
Geothermal energy is heat trapped or stored within the earth. Geothermal energy comes from the earth's interior, migrating slowly toward the surface. Geothermal energy is considered renewable (as long as the underground heat reservoir is able to conduct heat convert water to steam to generate electricity). Geothermal heat is also used to heat buildings, and provide hot water for bathing. Figure 15 is a geothermal resources map of the United States. (12) The United States leads the world in utilizing geothermal energy, with more that 70% being produced in California. Figure 16 shows an active geothermal plant located at the south end of the Salton Sea.
Wind Power
Wind power is the energy captured in moving air caused by the uneven heating of the earth's surface from the sun. The earth's surface consists of different types of land and water, and it absorbs the sun's energy at different rates. Figure 17 is a map of the conterminous United States showing average annual wind speed at a level 80 meters about the surface. (14) Wind power is used to generate electricity using wind turbines (Figure 18). Traditionally, wind power has been used to pump well water to the surface.
Hydropower
Hydropower has been used to mechanical energy for centuries before it became a source for electrical power generation. Nearly all major rivers in the United States have been dammed to generate electricity (and maintain flood control and water supplies). Hydroelectric power accounts for about 37% of the total of renewable electricity generation, but the total share of electricity produce by hydropower is decreasing. (17) This is partly due to environmental concerns, water loss due to evaporation, and the impact of seasonal and long-term drought on river systems and water supply, particularly in the western United States (Figure 19).
Biomass & Biofuels
Biomass & biofuels are organic materials that comes from plants and animals and is a renewable source of energy. Biofuel refers to any fuel derived from biomass, including, synthetic gases, ethanol and biodiesel fuels. Biomass energy accounts for about 5% of total primary energy use in the United States. (19) Figure 21 illustrates the variety of biofuel sources. Woody biomass are the trees and woody plants grown in a forest, woodland, or rangeland environment, that are the by-products of forest management. Figure 22 is an assessment map of U.S. National Forest Service land with resource potential for biomass energy development. (20)
Click here to see Biomass explained: U.S. Energy Information Administration website. (19)
Solar Energy
The sun's radiant energy is the source of power behind all forms of energy consumed (except nuclear and geothermal power). Solar energy has been used for direct and passive solar heating of building, greenhouses, and water in buildings and pools for centuries. Over the last century technologies have advanced that allow conversion of solar energy into electrical power by powering steam turbines and directly with photo-voltaic panels. The arid climate and typically clear skies of the American Southwest is best suited for generating solar energy in the United States (Figures 23 and 24).
Nuclear Power
According to the U.S. Environmental Protection Agency, ,nuclear reactors generate about 20% of all of the electricity used in the United States. (23) Twelve U.S. states generate more than 30% of their electricity from nuclear power. (24) Although historically, nuclear energy has many problems related to disasters including the Chernobyl, Fukushima, Three Mile Island, among others. The U.S. Energy Information Administration states are 60 commercially operating nuclear power plants with 98 nuclear reactors in 30 U.S. states (this doesn't include military power facilities). Despite the justifiable fears of nuclear energy, if done right, it is remarkably clean and new technologies are making it safer to use. Nuclear fusion power is possibly in our future, but will likely be many years before it becomes economically feasible.
Non-Energy Materials
- 10,765 pounds of stone
- 7,254 pounds of sand and gravel
- 685 pounds of cement
- 148 pounds of clays
- 383 pounds of salt
- 275 pounds of iron ore
- 168 pounds of phosphate rock
- 35 pounds of soda ash
- 34 pounds of aluminum
- 12 pounds of copper
- 11 pounds of lead
- 6 pounds of zinc
- 5 pounds of manganese
- 25 pounds of other metals
- 584 pound of other non-metals
Mining Rocks, Minerals and Metals
Most non-biological materials produced and consumed come directly from mining operations (such as shown in Figure 27). However, recycling of metals and other non-metal materials is increasing for some materials that are expensive to mine, are in short supply, or controlled hazardous material (making recycling economically profitable).
The Most Exploited Mineral Commodities
U.S. mines produced approximately $82.3 billion in minerals in 2020 (29) In terms of volume, the most exploited "mine-able" mineral commodities worldwide are iron ore, coal, potash, and copper.
Iron ore is any of the raw and recycled materials used to make pig iron, which is refined to make steel and other iron metal alloys. Iron (and steel) is primarily used in construction and manufactured products (ranging from small items like nails and kitchen utensils, to large items including pipes, construction framework, rail lines, bridges, to large ships).
Coal is primarily used as fuel for generating electricity, heating, and refining iron.
Potash includes various mined and manufactured salts that contain potassium in water-soluble form. Potash is a primary ingredient in fertilizer, and detergents, ceramics, and many other potassium-bearing compounds.
Copper is primarily used in all things electrical (wire). China is becoming the top mining country for many commodities, especially for the highly demanded rare earths, of which China produced nearly 58 percent of the global production in 2020. China is also the third-largest producer of iron ore and is the world’s leading country in the mine production of gold.
Construction Materials
Below is a list of the most important construction materials:
Concrete
Concrete is the most widely used building material in the world. Although the terms concrete and cement are often are used interchangeably, cement is actually an ingredient of concrete. Concrete is a mixture of aggregates (various kinds of sand and gravel) combined with a paste of cement. Cement is manufactured through the chemical combination of 8 main ingredients during the cement production process including limestone, clay, marl, shale, chalk, sand, bauxite, and iron ore. Figure 29 shows a view of a large limestone mine on the flanks of the San Bernardino Mountains in Lucerne Valley. The limestone is crushed an baked into lime and mixed with other ingredients to make cement and concrete.
Aggregate Materials
Aggregates are a non-renewable resource simply grains or fragments of rock, mined, processed, transported, and sold, typically in bulk form (typically bagged or by the truck load). They are raw rock and sedimentary materials that are mined from natural sources (extracted from pits and quarries) including gravel, sand, and crushed stone. Figure 30 shows an example of a natural sand-and-gravel deposit associated with an ancient river terrace along the Colorado River near Blythe, CA. It is poorly consolidated alluvial deposits that are commonly mined and processed to create aggregate materials.

Fig. 31. Large boulders used for yard displays and walls. | 
Fig. 32. Sand and degraded granite from various sources.
| 
Fig. 33. Decorative yard gravels from many sources. | 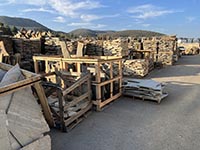
Fig. 34. Stone slabs of various rock types. | 
Fig. 35. Decorative cut-and-polished stone display. |
Conservation and Preservation
Conservation seeks the sustainable use of natural resources by humans, for activities such as logging or mining, while preservation means protecting nature from human use. Conservation involves the careful maintenance and upkeep of a natural resource to prevent it from disappearing. Conservation involves the care and protection of these resources so that they can persist for future generations.
Recycled Materials
All of us have a role in conserving natural resources. Earth Day is now an annual national awareness day that focuses on natural resources conservation with event hosted by nearly every federal and state governmental organization and many national, state, and local organization within communities everywhere.
Learn more about "Earth Day Every Day" at https://www.earthday.org/
Information Sources
All web URLs listed below were actively working as of 2/15/2022.
(1) Minerals Education Coalition, 2021, How many pounds of minerals are required by the average person in a year?
https://www.usgs.gov/faqs/how-many-pounds-minerals-are-required-average-person-year
(2) Science, Solutions, Solidarity For A Livable Future: United Nations Climate Action: https://www.un.org/climatechange
(3) Use of Raw Materials in the United States From 1900 Through 2014: U.S. Geological Survey Fact Sheet 2017-3062: https://pubs.usgs.gov/fs/2017/3062/fs20173062.pdf
(4) Energy Production and Consumption: Our World in Data [website]. https://ourworldindata.org/energy-production-consumption
(5) EIA projects nearly 50% increase in world energy usage by 2050, led by growth in Asia: chart from International Energy Outlook 2019, posted on Today in Energy: U.S. Energy Information Information Administration website: https://www.eia.gov/todayinenergy/detail.php?id=41433
(6) Non-fossil fuel sources accounted for 21% of U.S. energy consumption in 2020: Today in Energy: U.S. Energy Information Information Administration website: https://www.eia.gov/todayinenergy/detail.php?id=48576
(7) Where our oil comes from: U.S. Energy Information Information Administration website:
https://www.eia.gov/energyexplained/oil-and-petroleum-products/where-our-oil-comes-from.php
(8) Oil and petroleum products explained: U.S. Energy Information Administration website: https://www.eia.gov/energyexplained/oil-and-petroleum-products/
(9) National Oil and Gas Assessments: U.S. Geological Survey website: https://certmapper.cr.usgs.gov/data/apps/noga-drupal/
(10) Coal Explained: U.S. Energy Information Administration website: https://www.eia.gov/energyexplained/coal/
(11) USGS Coalfields of the Conterminous United States: U.S. Geological Survey website: https://www.usgs.gov/media/images/usgs-coalfields-conterminous-united-states
(12) U.S. has large geothermal resources, but recent growth is slower than wind or solar: Today in Energy: U.S. Energy Information Administration website (11/18/2011): https://www.eia.gov/todayinenergy/detail.php?id=3970#
(13) Geothermal basics: U.S. Energy Information Administration website: https://www.eia.gov/kids/energy-sources/geothermal/
(14) U.S. Average Annual Wind Speed at 80 Meters: U.S. Department of Energy: https://windexchange.energy.gov/maps-data/319
(15) Wind Explained: U.S. Energy Information Administration website: https://www.eia.gov/energyexplained/wind/
(16) WINDExchange: U.S. Department of Energy, Office of Energy Efficiency & Renewable Energy: https://windexchange.energy.gov/
(17) Hydropower explained: U.S. Energy Information Administration website: https://www.eia.gov/energyexplained/hydropower/
(18) The 2020 National Hydropower Map: (Oak Ridge National Laboratory): https://hydrosource.ornl.gov/map/2020-national-hydropower-map
(19) Biomass: U.S. Department of Agriculture, Climate Hubs website: https://www.climatehubs.usda.gov/commodity/biomass
(20) Biomass explained: U.S. Energy Information Administration website: https://www.eia.gov/energyexplained/biomass/
(21) Direct Normal Solar Irradience: National Solar Radiation Database Physical Solar Model: National Renewable Energy Laboratory, U.S. Department of Energy and U.S. Energy Information Administration website: https://www.eia.gov/energyexplained/solar/where-solar-is-found.php
(22) Solar explained: U.S. Energy Information Administration website. https://www.eia.gov/energyexplained/solar/
(23) Nuclear Power Plants: US Environmental Protection Agency website: https://www.epa.gov/radtown/nuclear-power-plants
(24) Twelve U.S. states generate more than 30% of their electricity from nuclear power: Today In Energy, March 26, 2020: U.S. Energy Information Administration website: https://www.eia.gov/todayinenergy/detail.php?id=43256
(25) Nuclear Explained: U.S. Energy Information Administration website: https://www.eia.gov/energyexplained/nuclear/
(26) National Minerals Information Center (US Geological Survey) website: https://www.usgs.gov/centers/national-minerals-information-center
(27) Mineral Commodity Summaries 2020: U.S. Geological Survey National Minerals Information Center:
https://pubs.usgs.gov/periodicals/mcs2020/mcs2020.pdf
(28) Active mines and mineral plants in the US (2003): U.S. Geological Survey interactive mineplant map database: https://mrdata.usgs.gov/mineplant/
(29) US Mines Produced an Estimated $82.3 Billion in Minerals During 2020: U.S. Geological Survey, Office of Communications and Publishing: https://www.usgs.gov/news/national-news-release/us-mines-produced-estimated-823-billion-minerals-during-2020
(30) U.S. Geological Survey, Congressional Statement , March 21, 2017, Before the House Committee on Natural Resources Subcommittee on Energy and Mineral Resource, regarding the importance of domestically sourced raw materials for infrastructure projects: https://www.usgs.gov/congressional/statement-us-geological-survey
(31) U.S. Geological Survey, National New Release, 2022, U.S. Geological Survey Releases 2022 List of Critical Minerals: https://www.usgs.gov/news/national-news-release/us-geological-survey-releases-2022-list-critical-minerals
| https://gotbooks.miracosta.edu/fieldtrips/rocks/natural_resources/index.html | 10/14/2022 |
